A Real-Time Geopolitical Risk Index, in Plain Language
We built a geopolitical-risk index from Telegram in real time, then asked which way the causal arrows actually point. Two answers were honest about their own limits — and one of them is why we don't sell price predictions.
By Andrés Azqueta-Gavaldón, Borja Ureta
Most geopolitical-risk indices are built from newspapers. That makes them careful — and slow. By the time an event is filed, edited, and published, the market has often already moved.
Our paper, CausalAlpha, asks a simple question with an awkward answer: if you measure geopolitical risk in real time from open-source channels, and then test which way the causality actually runs, what holds up? This is the plain-language version. The full paper is on arXiv.
The one-sentence version: Political and energy coverage causally precede conflict coverage in real-time channels — but the link from those signals to daily asset prices is statistically weak. The signal lives in the media narrative, not in tomorrow's close.
Why newspapers are too slow
The standard measure of geopolitical risk is the GPR index of Caldara and Iacoviello (2022) — a monthly series built by counting risk words across newspaper archives. It is the right tool for studying decades of history. It is the wrong tool for a market that reprices in minutes.
Encrypted messaging — Telegram in particular — has become a live layer of open-source intelligence (OSINT). Conflict monitors, military analysts, and investigative journalists frequently post there before the wire services catch up. In the Russia–Ukraine conflict, intelligence on troop movements circulated on social media in the hours before the full-scale invasion was announced.
So we built the index where the information actually shows up first.
What CausalAlpha measures
CausalAlpha reads six OSINT and independent-news Telegram channels, chosen to balance neutral intelligence sources with editorially independent journalism — and to deliberately exclude channels with documented pro-Kremlin or disinformation profiles.
The corpus
Bellingcat, WarTranslated, Reuters World, BBC World, Kyiv Independent, and Meduza — 19,543 English-language messages from April 2025 to April 2026. A keyword-based NLP pipeline tags each message and updates the index daily.
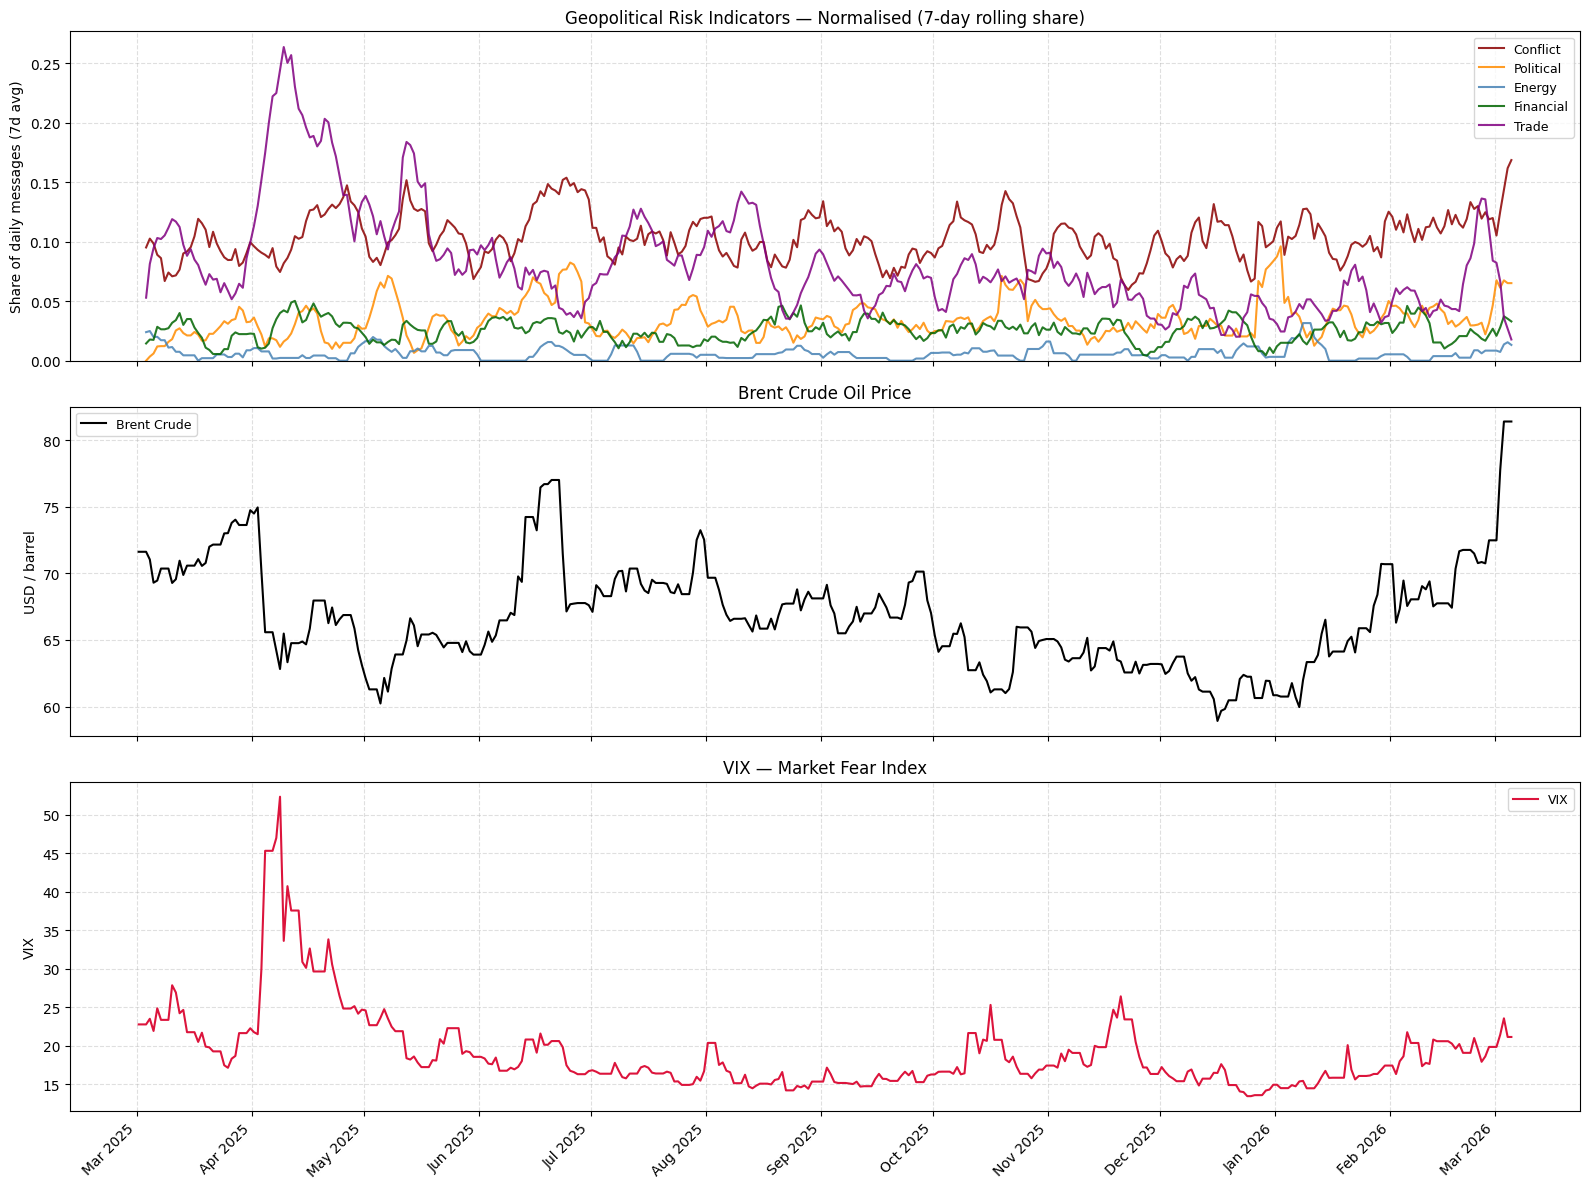
Rather than one aggregate number, we publish five category-specific indicators. Each is the share of the day's messages that mention that category's keywords, smoothed with a 7-day rolling window. Here is how the coverage splits over the sample:
The shares add to more than 100% because a single message can light up several categories at once — which is exactly the co-occurrence signal we want. The Energy indicator shows the most telling feature: it sat at 2–5% of messages until July 2025, then stepped permanently up to 10–20% as Ukrainian drone strikes took roughly 40% of Russia's oil-refining capacity offline. That is not a data artifact — it is the news cycle reorganizing around energy infrastructure.
Reading direction, not just correlation
Most "signal" research stops at correlation: this moved, that moved, they look related. Correlation can't tell you which one led — and with shared global drivers, two things can move together for a third reason entirely.
So we use causal discovery — specifically the PC algorithm — instead of pairwise tests like Granger causality. The difference matters.
What causal discovery does
The PC algorithm tests whether two variables stay related after conditioning on everything else in the system. If the apparent link dissolves once you account for the common causes, it removes the edge. What survives is a map of directed arrows — a causal graph — rather than a list of correlations.
We run it over the five indicators plus a broad set of 16 financial-market variables — Brent, gold, wheat, copper, natural gas, silver, four FX pairs, the S&P 500 and its energy, defense, and financials sector ETFs, emerging-market and high-yield bonds, and the VIX. To make sure a finding isn't an artifact of one particular variable set, we estimate four different market sub-panels across three significance thresholds, and bootstrap every edge 500 times. A result only counts as robust if it shows up everywhere.
What the data actually says
Three relationships are globally robust — present in all four market panels:
In other words, conflict coverage is the causal sink of the system. It's not a primitive signal you can front-run — it's the aggregation point that political and energy stories flow into. The third robust edge is mechanical but reassuring: falling equities (ΔS&P 500) drive the VIX, the well-known leverage effect, which tells us the method recovers relationships we already know are real.
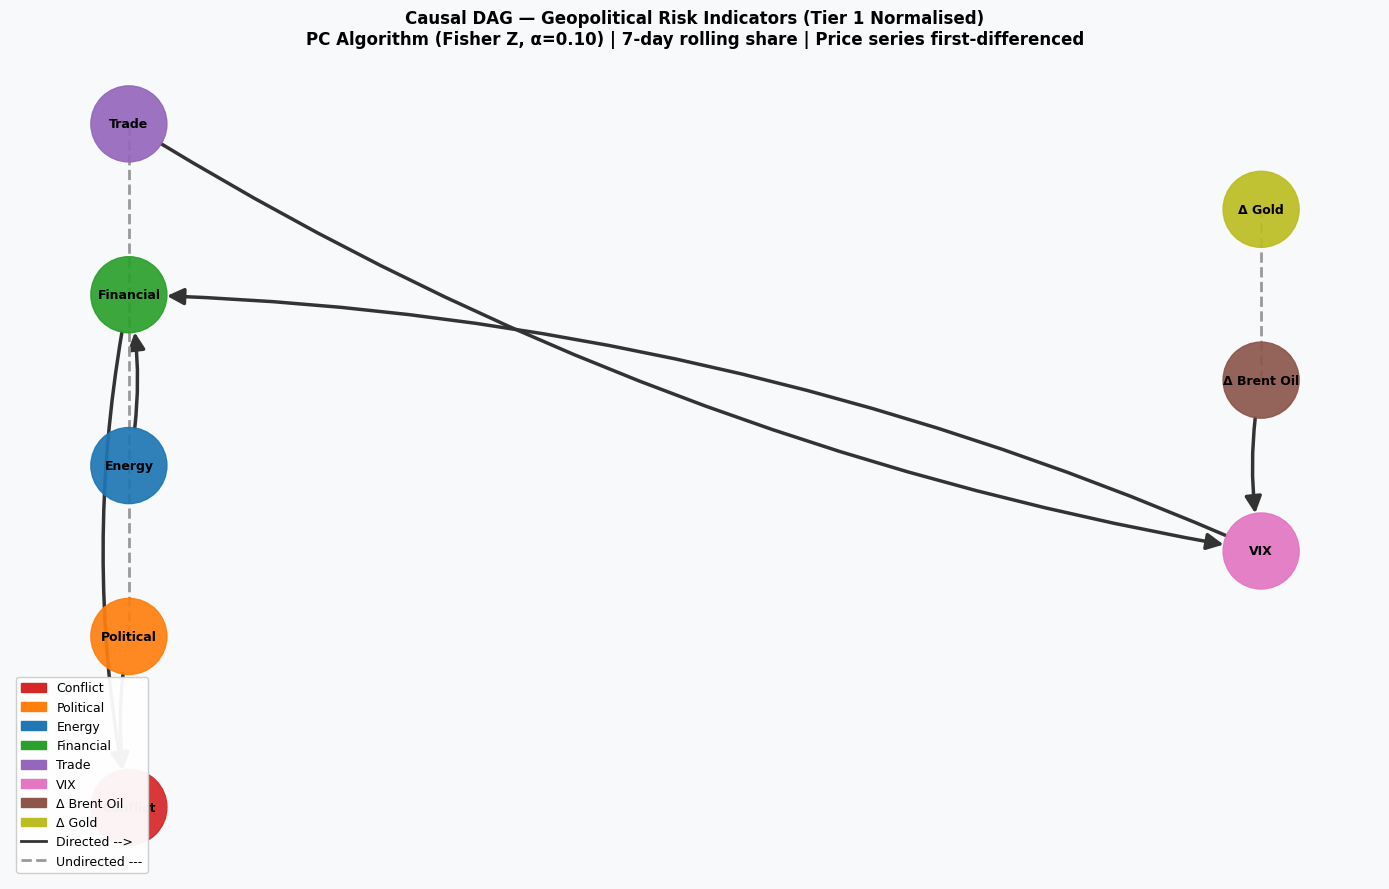
Two more findings are worth naming because they survive the strictest test (a 0.05 significance level), where most edges drop out:
EM bonds → VIX
Emerging-market sovereign-bond selloffs causally precede rises in equity volatility — an early-warning signal of broader market fear. This is the most statistically conservative result in the paper.
Conflict → energy equity (XLE)
At the strictest threshold, conflict coverage precedes energy-sector equity returns — escalation transmitting to energy markets. The single most resampling-stable edge in the study, though its direction is threshold-sensitive.
The honest part: it does not predict prices
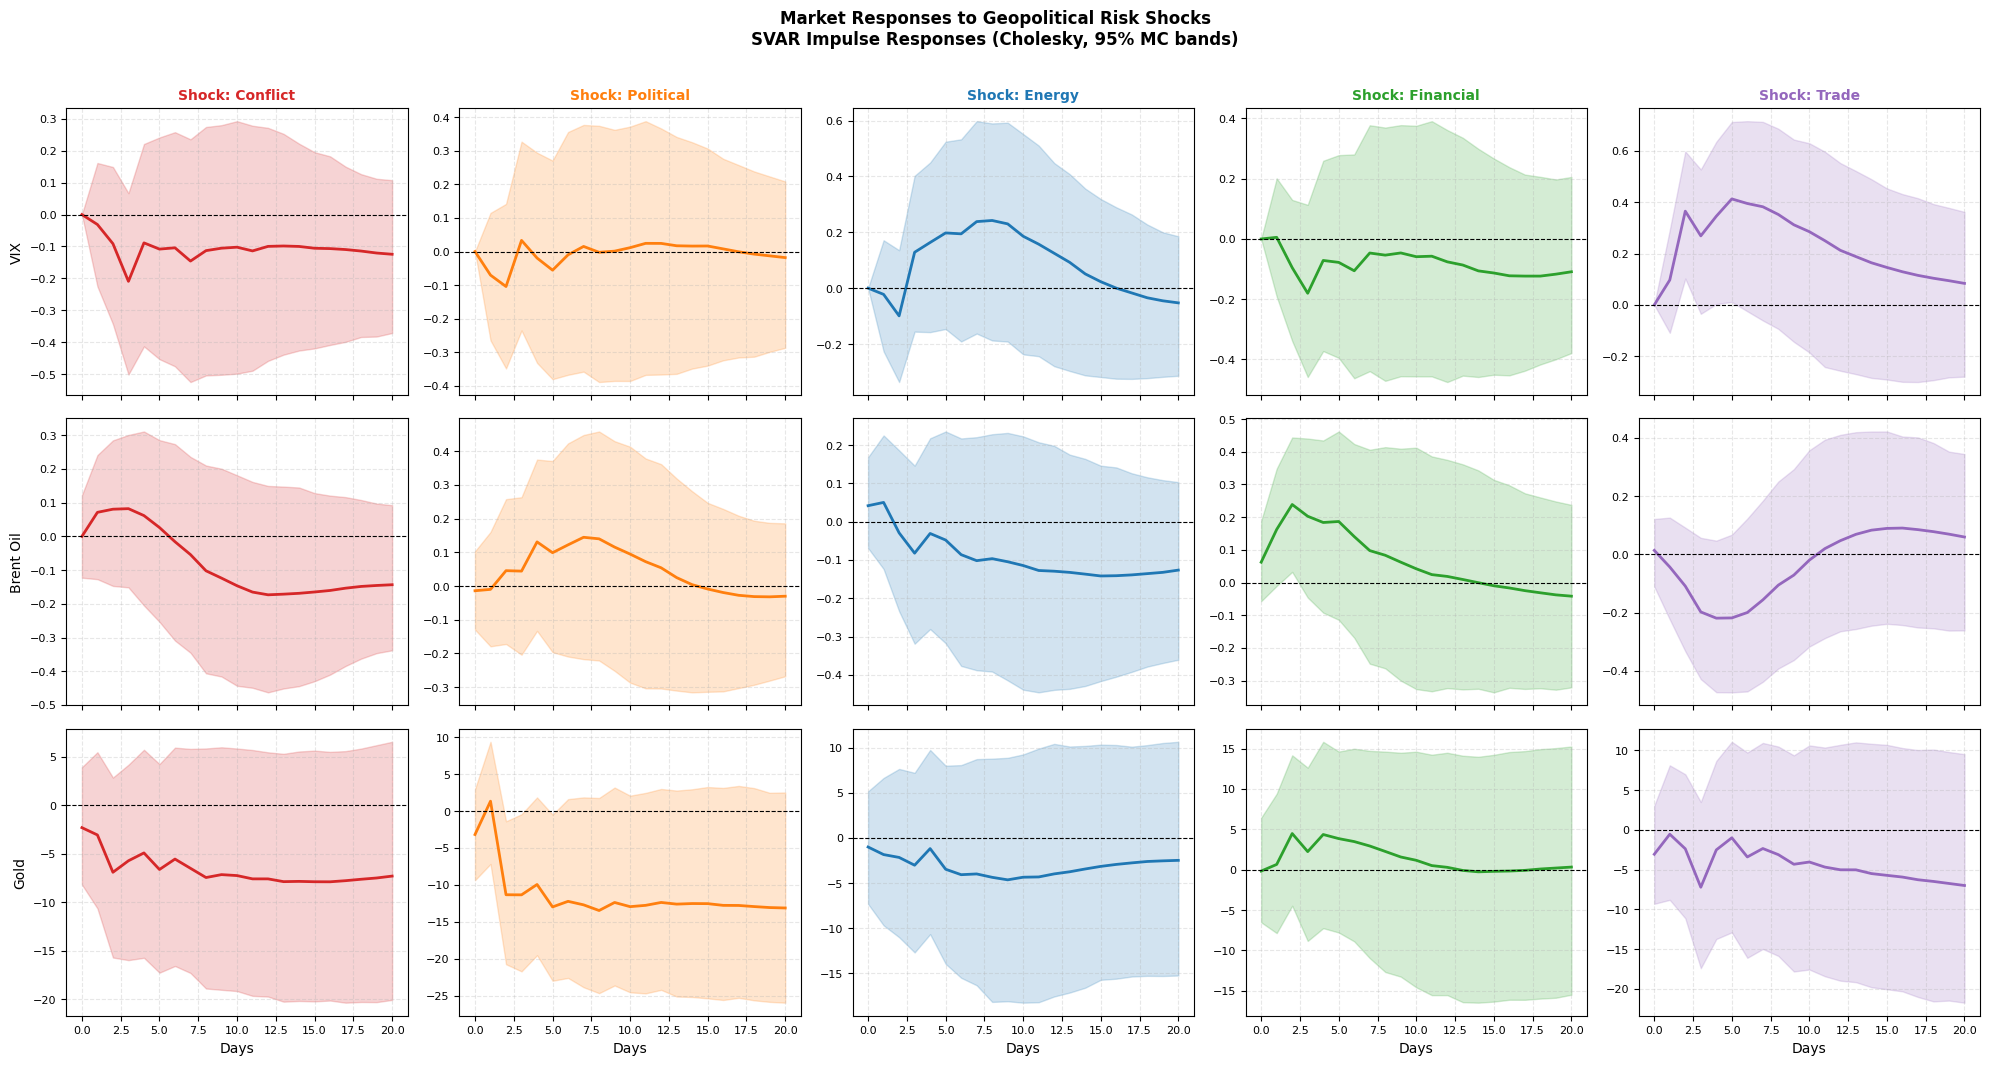
Here is the finding we lead with, even though it's the one a vendor would bury. We ran a structural VAR to trace how a shock to each geopolitical indicator ripples into market prices over the following days.
The confidence bands are wide and include zero for virtually every geopolitical-shock-to-price pair. The geopolitical indicators explain less than 5% of the forecast variance of the VIX, Brent, gold, and the S&P 500 at every horizon.
What that means: at daily frequency, our geopolitical signals move the media narrative — how conflict and energy stress get covered — far more than they move the next day's prices. By the time a story is countable in the news, the market has usually already absorbed it.
This is why CausalAlpha is a risk-monitoring tool, not investment advice — and why our own product says so. The research disciplines the claim.
Where prediction markets come in
If geopolitical information reaches prices faster than it reaches the news, the obvious question is: where can you actually see it in flight? Our answer — and the bridge to what CausalAlpha runs today — is prediction markets.
We extend the framework with a live Polymarket data layer: a curated set of liquid geopolitical contracts (filtered for real volume and tight spreads), giving a forward-looking, money-backed probability for each risk category. The hypothesis is a three-layer information chain:
OSINT narratives → prediction-market probabilities → asset prices. Each layer may lead the next: the news frames the story, the market prices the odds, and only then does it fully reach the broader tape.
The motivating episode is stark. As documented by Genç (2026), six wallets earned roughly $1.2 million betting on Polymarket contracts tied to Iranian military developments before the strikes appeared in news coverage. Prediction markets may incorporate non-public information ahead of both OSINT channels and traditional media — which is precisely why our live markets board watches them.
What to take from it — and what not to
This is a conflict-intensive sample. The corpus leans heavily on Russia–Ukraine, so the results describe geopolitical conflict risk, not geopolitical risk in general — broadening to trade and sovereign-stress coverage is future work. And the Financial indicator is sparse enough that any edge touching it deserves extra caution.
What survives is still a clear, useful picture: monitor political and energy narratives and you get a leading read on conflict escalation — earlier than a monthly newspaper index would give it to you. Just don't mistake a narrative signal for a price signal. The whole point of the paper is knowing the difference.
The full methodology, every edge list, and the robustness checks are in the paper on arXiv. There's also an accessible summary on Gist.Science.
Get the daily briefing
New research lands here; the daily risk read lands in your inbox after each market close.